Text Analytics & Unsupervised NLP - Part I
This article will run through unsupervised text analytics using Python. The corpus (a collection of text, documents) we will be using is made up of 47 news articles from various online sources. The set is available for download in my github repository.
This is part one of a three part series focusing on Text Analytics and NLP. All will be using the same corpus and will build off of one another.
Part I - Prepare Data, Assemble list of Stop Words, Tokenize, Analyze N-Grams Part II - Clustering: Words, Document-topics, & Topic Modeling Part III - Markovify and Sentence, Article summary generation
First thing you’ll want to do is open up command prompt or bash and install the following packages if you don’t already have them. Install one by one, as they have different prompts that you’ll need to hit ‘y’ for to resume download.
pip install nltk
pip install linguistica
Once those are installed, fire up a Jupyter Notebook or your preferred programming tool. You might need to finish up the nltk download by running the following:
import nltk
nltk.download()
An external window should pop up so try minimizing your browser to find it. You’ll wrap up the download in the pop-up window.
Data Preparation
Import data & create corpus
path_to_data = 'data/'
newcorpus = PlaintextCorpusReader(path_to_data, '.*txt',encoding='utf8')

# get a list of all of the files
files = list( newcorpus.fileids() )

# get a list of each file's raw text and clean it up
rawText = [newcorpus.raw(f).replace('\r\n',' ').replace('\n',' ') for f in files]

# combine the two lists into one list of lists
# there will be a list of two items for each article, containing file name and raw text
data = [[f,t] for f,t in zip(files,rawText)]

# turn the list of lists into a dataframe
data = pd.DataFrame(data, columns=['filename','rawText'])
Tokenize
Stop Words
Create a list of stop words– words that only serve to create noise in your analysis. The importance of having stop words will be shown later in the post. There’s a great list of words I found online, which I”ll combine with the list you can get from the nltk package.
# STOP WORDS
# imported list
stop_words_standard = stopwords.words('english')

# long list [source](https://www.ranks.nl/stopwords)
stop_words_long = open('stop_words.txt','r',encoding='utf-8').read().split('\n')

# add all into one list
stop = set(stop_words_standard + stop_words_long)
Stemming, Punctuation Stripping
Create a stemmer to break down our words, and a function to remove punctuation.
stemmer = PorterStemmer()
re_punct = re.compile('[' + ''.join(string.punctuation) + ']')
Actual tokenization
We will have 3 lists of tokens.
- tokens_raw: this will be the raw text of the articles, converted to lowercase
- tokens_clean: this takes tokens_raw and then removes words that exist in our list of stop words
- tokens_stem: this takes tokens_clean and converts them into the word’s stem
# create the new, empty columns
data['tokens_raw']   = None
data['tokens_clean'] = None
data['tokens_stem']  = None

for row in data.index.tolist():

    # get a raw list of tokens
    text = data.loc[row,'rawText'].lower()             # convert all text to lowercase
    tokens = word_tokenize(text)                       # tokenize the text, meaning turn text into a list of words
    tokens = [re.sub(re_punct, '', t) for t in tokens] # if any of the words have punctuation in them, remove it
    tokens = [t for t in tokens if len(t) > 2]         # if the length of the token is over 2 letters, keep it

    data.loc[row,'tokens_raw'] = ' '.join(tokens)      # set the tokens_raw column to this list of tokens

    # clean up tokens -- remove digits and stop words
    tokens = [re.sub(r'[0-9]', '' , t) for t in tokens] # if any of the words have digits, remove them
    tokens = [t for t in tokens if not t in stop]       # take only the words/tokens that aren't in the list of stop words

    data.loc[row, 'tokens_clean'] = ' '.join(tokens)    # set tokens_clean to the cleaned up list of tokens

    tokens = [stemmer.stem(t) for t in tokens]          # stem the tokens (take the root of the word)

    data.loc[row, 'tokens_stem'] = ' '.join(tokens)     # set tokens_stem to the stemmed tokens
Visualize difference in Word Counts, Character Counts across Raw Text and Token types
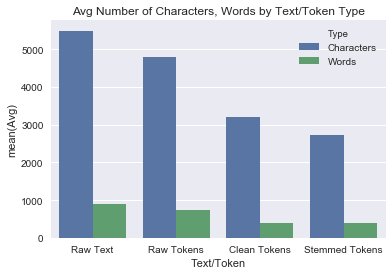
See how cleaning up our raw text in the various token groups affects the number of words present and the length of the text.
char_len, char_len_raw, char_len_clean, char_len_stem = 0,0,0,0
word_len, word_len_raw, word_len_clean, word_len_stem = 0,0,0,0
n = len(data)
for row in range(0, n):

    char_len += len(data.rawText.iloc[row])
    word_len += len(data.rawText.iloc[row].split())

    char_len_raw += len(data.tokens_raw.iloc[row])
    word_len_raw += len(data.tokens_raw.iloc[row].split())

    char_len_clean += len(data.tokens_clean.iloc[row])
    word_len_clean += len(data.tokens_clean.iloc[row].split())

    char_len_stem += len(data.tokens_stem.iloc[row])
    word_len_stem += len(data.tokens_stem.iloc[row].split())

types = ['Raw Text','Raw Tokens','Clean Tokens','Stemmed Tokens'] * 2
hues = ['Characters'] * 4 + ['Words'] * 4
nums = [num/n for num in [char_len, char_len_raw, char_len_clean, char_len_stem, word_len, word_len_raw, word_len_clean, word_len_stem]]
# nums = [num/n for num in nums]
data = [[t,h,n] for t,h,n in zip(types,hues,nums)]
dtypes= {'Type':'category','Hue':'category','Avg':'integer'}
df = pd.DataFrame(data,columns=['Text/Token','Type','Avg'])

import seaborn as sns
from matplotlib import pyplot as plt
%matplotlib inline
plt.title('Avg Number of Characters, Words by Text/Token Type')
sns.barplot(x='Text/Token', y="Avg",hue='Type',data=df);

Notice the huge jump from the raw tokens to the clean tokens, due to our list of stop words. Also, see how the word count from cleaned to stemmed tokens remains the same, but the character count drops a bit. Stemming the tokens keeps the same number of words, but just uses the shorter root form.
N-Grams
To look at the frequences of different word pairings, we’ll create lists of uni, bi, and tri-grams for each token type. It’s not necessary to always do this for each token type–perhaps you prefer to always work with stemmed tokens.
The same process of creating tables of n-grams will be repeated for raw, clean, and stemmed tokens. All tables will be placed into a single dictionary for easy access.
import linguistica as lxa

# create emtpy dictionary to hold all tables
all_data = dict()

for token_type in ['raw','clean','stem']:
    tokens = []
    for row in df.index.tolist():
        # add its raw, clean, and stemmed tokens onto their respective lists
        tokens += df.loc[row,'tokens_'+token_type].split()

    # next, create lxa objects which allow us to get n-gram frequencies
    lxa_object   = lxa.from_corpus(tokens)

    # create dictionaries of n-grams for each token list
    unigrams = lxa_object.word_unigram_counter()
    bigrams = lxa_object.word_bigram_counter()
    trigrams = lxa_object.word_trigram_counter()

    # convert to dataframes
    df_unigrams   = DataFrame.from_dict(unigrams_raw, orient='index').reset_index().rename(columns=columns)
    df_bigrams    = DataFrame.from_dict(bigrams_raw,  orient='index').reset_index().rename(columns=columns)
    df_trigrams   = DataFrame.from_dict(trigrams_raw, orient='index').reset_index().rename(columns=columns)
    df_unigrams.rename(columns = {'Word':'word1'}, inplace=True)
    df_bigrams[['word1', 'word2']] = df_bigrams['Word'].apply(Series)
    df_trigrams[['word1', 'word2', 'word3']] = df_trigrams['Word'].apply(Series)
    df_bigrams.drop('Word',axis=1,inplace=True)
    df_trigrams.drop('Word',axis=1,inplace=True)

    # add tables to the dictionary
    all_data['unigrams_' + token_type] = df_unigrams
    all_data['bigrams_'  + token_type] = df_bigrams
    all_data['trigrams_' + token_type] = df_trigrams

all_data.keys()
We now have a separate dataframe for each token type and n-gram that we can access by referencing the following dictionary keys:
dict_keys(['unigrams_raw', 'bigrams_raw', 'trigrams_raw', 'unigrams_clean', 'bigrams_clean', 'trigrams_clean', 'unigrams_stem', 'bigrams_stem', 'trigrams_stem'])
Here’s a function to help simply the process of visualizing our n-grams:
def viz(chart_data, num_grams=30, ascending=False, font_scale=1, chart_scale='poster', chart_size=15, save_to_file=False,title=""):
    import seaborn as sns
    from matplotlib import pyplot as plt
    chart_data = chart_data.head(num_grams).reset_index().sort_values(by='Frequency',ascending=ascending).copy()

    n = len(chart_data.columns)
    if n == 3: # unigrams, 1 column of words
        chart_data.rename(columns={'word1':'N-Gram'},inplace=True)
    if n == 4: # bigrams, 2 columns of words
        chart_data['N-Gram'] = chart_data['word1'] + ', ' + chart_data['word2']
    if n == 5: # trigrams, 3 columns of words
        chart_data['N-Gram'] = chart_data['word1'] + ', ' + chart_data['word2'] + ', ' + chart_data['word3']

    sns.set_context(chart_scale, font_scale=font_scale)

    sns_plot = sns.factorplot(x="Frequency", y="N-Gram", data=chart_data, kind="bar", size = chart_size);
    sns.plt.title(title)
    plt.show();

    if save_to_file is not False:
        sns_plot.savefig(save_to_file)
Let’s use this function to compare some of our different tables:
grams = ['uni']*3 +['bi']*3 +['tri']*3
token_types = ['raw','clean','stem']*3
table_names = [gram + 'grams_'+ token_type for gram, token_type in zip(grams, token_types)]
token_types = [t.replace('stem','stemmed') for t in token_types]
titles = [t.title() + ' ' + gram.title() + 'grams' for t, gram in zip(token_types, grams)]

for table_name, title in zip(['unigrams_raw','unigrams_clean','unigrams_stem'],['Raw Unigrams','Clean Unigrams','Stemmed Unigrams']):
    viz(all_data[table_name].sort_values(by='Frequency',ascending=False),  num_grams=10,chart_scale='poster',chart_size = 8,title=title)


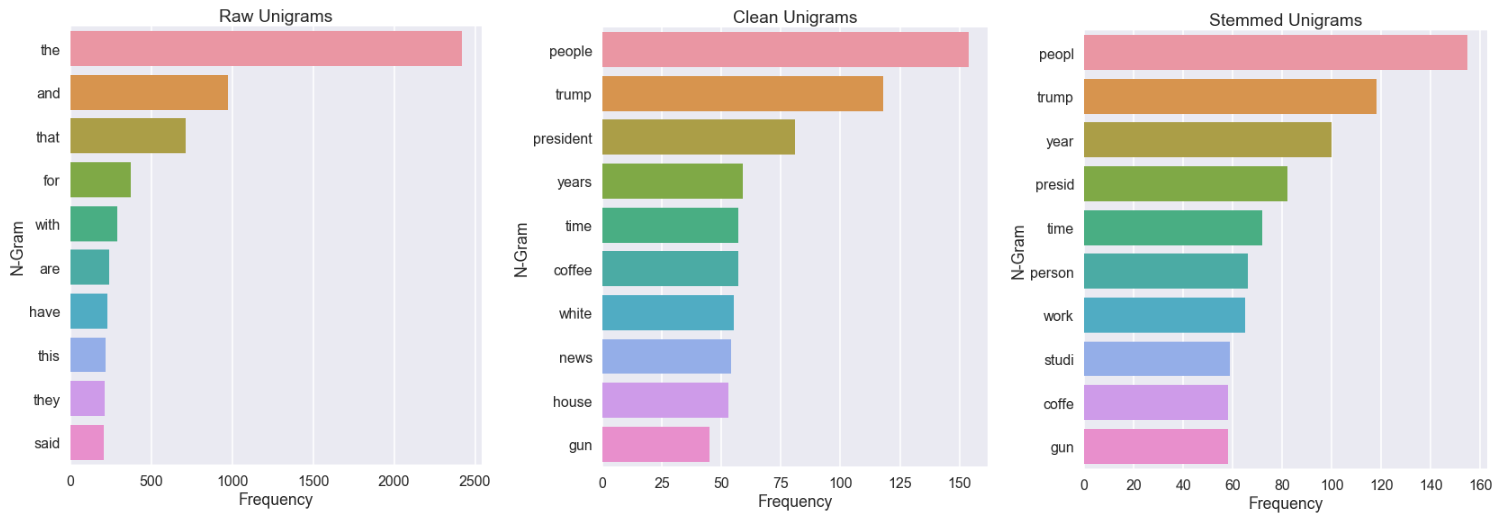
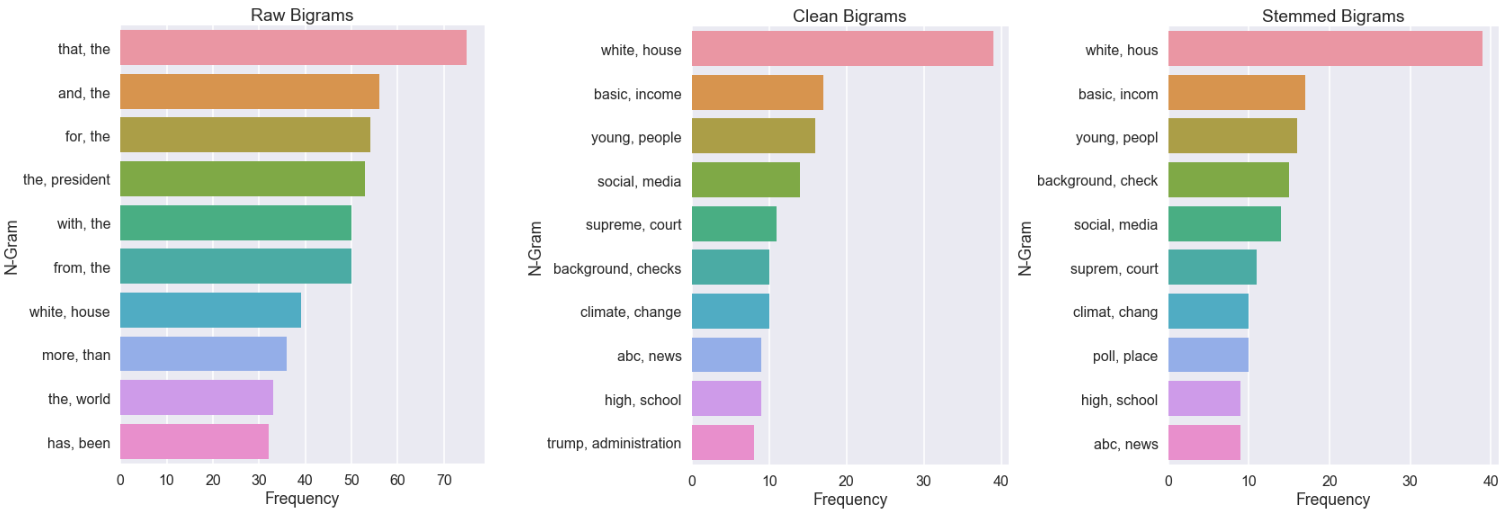
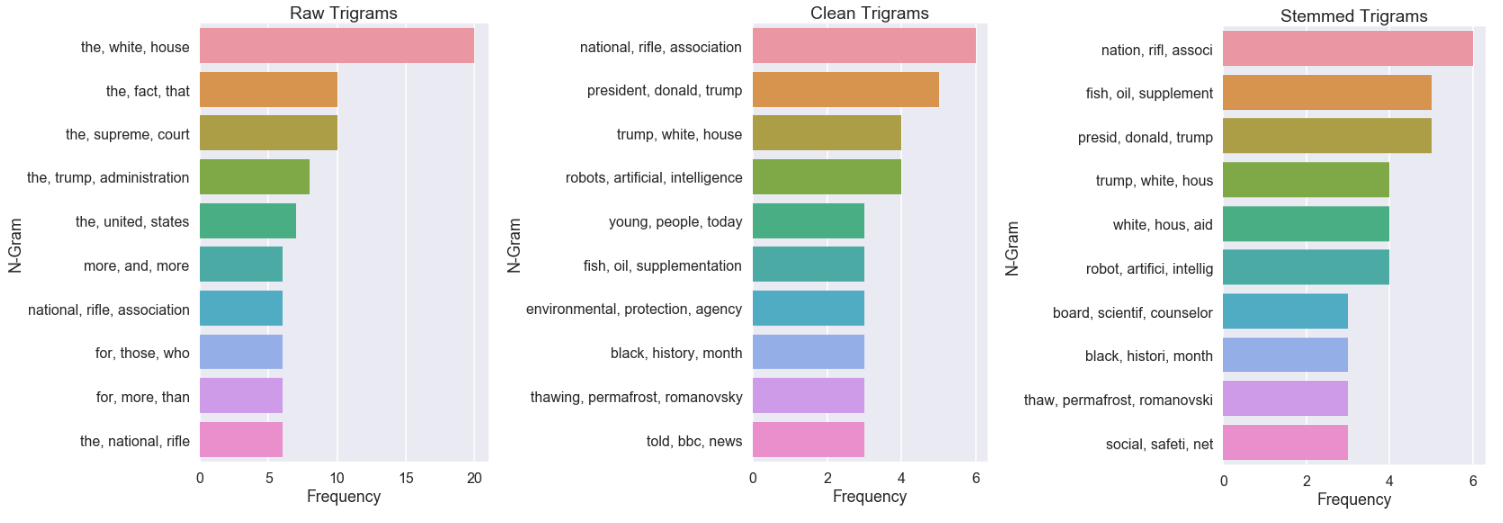
Now we’ve got a clear picture as to the importance of using stop words. Each raw chart presents the noise, while clean and stemmed charts show how we can focus better on the more important words.
When you do unsupervised problems like this, you’ll probably have far more data and a better idea of what words are noise. Just keep in mind that removing words will affect the outcome of your n-grams (bi gram and higher). Words that weren’t written side by side might now appear next to each other since a word in between them was a stop word, and as a result, removed. A solution for this is to analyze bi, tri and higher grams based on the raw text alone, as opposed to your clean and stemmed lists.
This wraps up the first part of three articles focused on text analytics and unsupervised NLP. A link will be included once part two is complete.